Performance and validation
This page summarizes the measured performance and parity status of the core
solver. All numbers come from checked-in benchmark artifacts —
benchmarks/baseline.json (CPU suite, regenerated with
benchmarks/run_baseline.py) and benchmarks/gpu_baseline.json (GPU
matrix, benchmarks/run_gpu_matrix.py; 2x NVIDIA RTX A4000, jax 0.6.2
cuda12) — and from the end-to-end parity suite in
tests/test_parity_breadth.py.
Benchmark suite (CPU, ns = 201)
Wall times in seconds; “cold” is a fresh process including JIT compilation,
“warm” is a second in-process solve reusing the compiled executable (the
number that matters inside optimization loops, where the structural
executable cache makes every solve after the first warm). Every deck’s
final NS_ARRAY stage is ramped to ns = 201 — production radial
resolution, where the physics dominates the compile overhead and the warm
comparison is fairest.
case |
VMEC2000 |
vmex cold |
vmex warm |
VMEC++ |
|---|---|---|---|---|
solovev |
1.41 |
11.5 |
0.62 |
1.45 |
li383_low_res (NCSX) |
1.06 |
8.3 |
0.69 |
0.53 |
nfp4_QH_warm_start |
1.91 |
10.9 |
1.32 |
1.35 |
nfp4_QH_warm_start (multigrid) |
1.89 |
29.1 |
1.44 |
1.56 |
circular_tokamak |
2.02 |
22.6 |
1.63 |
3.70 |
DSHAPE |
2.31 |
32.7 |
2.37 |
5.45 |
cth_like_fixed_bdy (multigrid) |
10.2 |
38.5 |
7.76 |
failed |
cth_like_fixed_bdy |
13.2 |
28.0 |
9.51 |
failed |
cth_like_free_bdy (free boundary) |
26.7 |
71.3 |
24.9 |
6.9 |
LandremanPaul2021_QA_lowres |
45.0 |
72.3 |
42.7 |
24.7 |
LandremanPaul2021_QA_lowres (multigrid) |
73.7 |
103.4 |
68.1 |
30.9 |
LandremanPaul2021_QH_reactorScale_lowres |
64.8 |
76.8 |
65.6 |
failed |
NuhrenbergZille_1988_QHS |
137 |
108 |
76.8 |
72.7 |
cth_like_free_bdy_lasym_small (free bdy, lasym) |
228 |
– |
196 |
n/a |
Bold marks vmex beating VMEC2000. These are wall-clock seconds on a
shared Apple-Silicon CPU (benchmarks/baseline.json), so the
warm/Fortran ratio is the comparable quantity, not the absolute numbers.
Reading the table:
Warm solves beat VMEC2000 on 12 of the 14 rows — typically 1.2–2.3x — and tie on the other two (DSHAPE, the reactor-scale QH). This includes both free-boundary rows: the NESTOR path converges to VMEC2000 parity and now edges out the Fortran wall clock.
Cold runs pay a one-time 7–30 s XLA compile, so a single fire-and-forget run is slower than Fortran — except on the biggest deck (NuhrenbergZille at ns=201), where even the cold run, compile included, beats VMEC2000. The persistent compilation cache removes most of the compile cost on subsequent processes.
VMEC++ is faster on some converged large decks (free boundary, LandremanPaul QA) but failed rows aborted during the first iterations;
vmexconverges on the full suite (zero-crash policy).n/amarks a configuration VMEC++ does not support (lasymfree boundary).
Production workflows: CPU vs GPU
benchmarks/profile_production.py times the five workflows a design
loop actually runs, at production resolution. Warm wall-clock, measured
2026-07-12 (CPU: local Apple-Silicon, idle; GPU: office 2x NVIDIA RTX
A4000, jax cuda12 — different hosts, so read each column on its own terms):
workflow (warm) |
M-series CPU |
A4000 GPU |
|---|---|---|
fixed-boundary solve, ns = 201 |
5.5 s (4.3 ms/iter) |
6.9 s (5.4 ms/iter) |
multigrid ladder 51/101/201 |
7.8 s |
9.3 s |
implicit |
17.3 s |
27.8 s |
|
88.8 s |
151 s |
The headline: a fast desktop CPU beats the A4000 GPU on every production
workflow, even at ns = 201. Forward solves are close (the GPU is
iteration-competitive at this size — free-boundary NESTOR runs 13.9 ms/iter
on the GPU), but the gradient pipeline is launch-bound on an accelerator,
which is why vmex.core.device.resolve_implicit_device() pins
implicit-gradient work to the CPU by default (an earlier placement leak
here cost 2x on GPU boxes — fixed, and the pin is now automatic). The
GPU’s wins come against slower server cores and larger-than-production
problem sizes (see the GPU guidance below).
Optimization wall time
Whole-campaign numbers, from a near-circular torus to a precise
configuration on a 36-core office CPU (details and scripts in
Optimization and differentiability): QA to QS 7.2e-6 in 14.5 min with a single
ESS-scaled least_squares call (the staged max_mode 1–5 ladder
reaches 3.7e-7 in 25.5 min), and QI to a 25x omnigenity-residual reduction
in 17.3 min. Two measured gradient-stack optimizations make that
possible — the block-tridiagonal implicit Jacobian (33x on the Jacobian
phase) and the perturbation warm start (3.7x fewer trial-solve iterations)
— both on by default and documented in Optimization and differentiability.
Parity with VMEC2000
Per-iteration algorithmic parity (same step control, preconditioner cadence, constants) means the solver does not just reach the same answer — it takes the same number of iterations as VMEC2000 on the benchmark decks:
case |
VMEC2000 iters |
vmex iters |
notes |
|---|---|---|---|
solovev |
215 |
215 |
exact match |
DSHAPE (multigrid 16/32/64/128) |
908 |
903 |
|
circular_tokamak (multigrid 10/17) |
368 |
368 |
exact match |
cth_like_fixed_bdy |
434 |
434 |
exact match |
nfp4_QH_warm_start (ns=35) |
450 |
450 |
exact match |
LandremanPaul2021_QA_lowres |
1000 |
1000 |
golden run is NITER-capped at its FTOL 1e-13 |
LandremanPaul2021_QH_reactorScale_lowres |
2408 |
2406 |
|
up_down_asymmetric_tokamak (lasym) |
2000 (capped) |
1951 |
both stopped at the matched residual 1.5e-13; a fully converged VMEC2000 rerun (fsq ~1e-16) matches the core to <= 7.3e-7 on every checked harmonic, in 3197 vs 3118 iterations |
li383_low_res (single grid, ns=16) |
123 |
within the ±25% parity gate |
Parity holds not just at the converged endpoint but along the whole
trajectory. The trace below runs the quick-start QH case
(nfp4_QH_warm_start, single grid at ns=51) through all three codes
and plots the total force residual fsqr + fsqz + fsql per iteration:
the vmex curve lies exactly on top of VMEC2000’s (both converge in 502
iterations), and VMEC++ follows a near-identical path (501 iterations).
The vmex trace comes from SolveResult.fsq_history, the VMEC2000
trace from its stdout iteration table run with NSTEP = 1, and the
VMEC++ trace from the fsqt array of its wout payload.
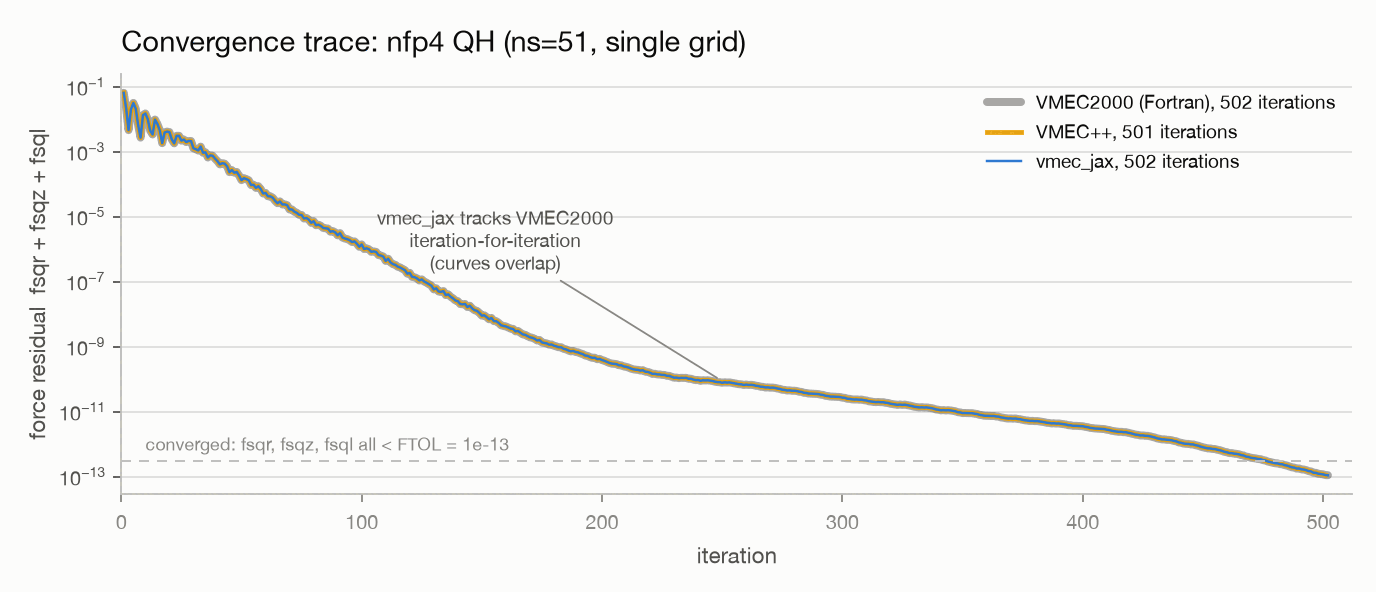
Force residual vs iteration on nfp4_QH_warm_start at ns=51
(benchmarks/make_readme_figures.py --only convergence; traces cached
in benchmarks/convergence_nfp4_ns51.json).
The parity suite additionally asserts, per case: convergence at the deck’s
ftol; wb within 1e-7 relative of the golden wout; boundary/interior
rmnc/zmns harmonics at rtol 1e-5; and iotaf at rtol 1e-5. Where the
golden VMEC2000 run is itself NITER-capped (LandremanPaul QA, the lasym
tokamak), both codes are stopped at a matched residual and the documented
absolute tolerances cover the golden run’s own remaining non-convergence.
wout files are compared per-variable with CompareWOut-style combined
rel+abs tolerances.
2D block preconditioner
The default 1D radial preconditioner is what reproduces VMEC2000
iteration-for-iteration. For stiff decks — very high aspect ratio or strong
finite-β coupling — an opt-in 2D block preconditioner
(vmex.core.preconditioner_2d) replaces the radial-only approximation
with a matrix-free Newton step: a Jacobian-vector-product Hessian applied
through GMRES (SOLVAX’s block_thomas_truncated / Krylov layer). It cuts the
iteration count 2.5–11x on the stiff cases below, and is a strict add-on — the
default 1D path stays byte-identical, so parity is untouched.
stiff case |
1D radial |
2D block |
reduction |
|---|---|---|---|
aspect-100 tokamak (a) |
97 |
18 |
5.4x |
aspect-100 tokamak (b) |
163 |
15 |
10.9x |
nfp4 QH, finite beta |
1885 |
204 |
9.2x |
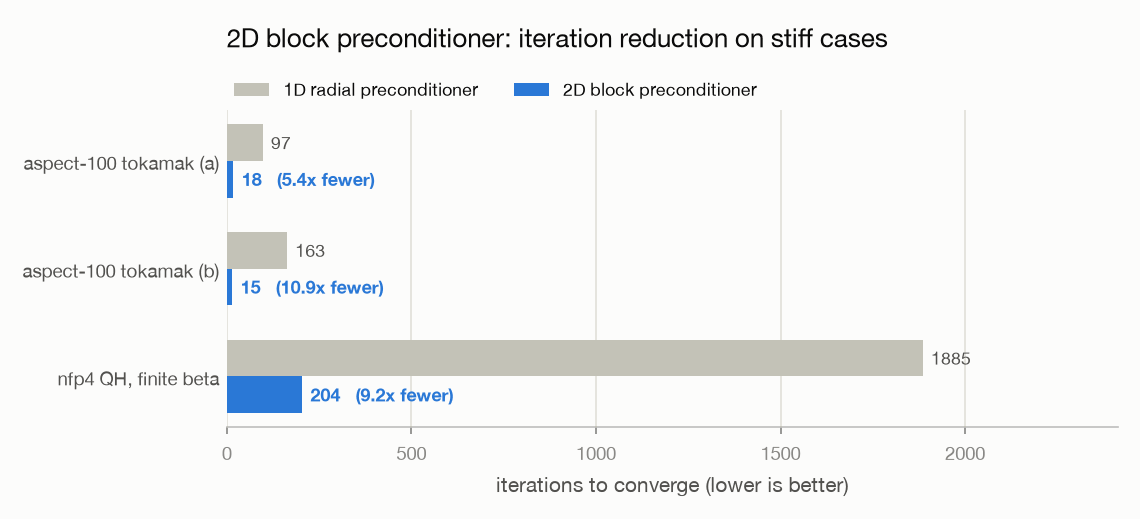
Iterations to converge, 2D block vs 1D radial preconditioner
(benchmarks/make_readme_figures.py --only precond).
It is opt-in, not the default, on purpose. Fewer iterations is not fewer
seconds: each 2D Newton step (a GMRES solve over Hessian-vector products) costs
far more than a 1D radial sweep, so the measured wall-clock ranges 0.55–1.16x
across easy and stiff decks — a wash to slower (≈2x slower on a plain circular
tokamak, a tie even on the aspect-100 case) — and peak memory is ≈30% higher
(the extra GMRES/HVP compile graph). The converged wb matches the 1D result
to ~1e-10, so it changes the path, not the fixed point. Reach for it when the
1D iteration count is the bottleneck or stalls, not as a blanket default.
Memory
Peak resident memory (0.6–1.5 GB, up to ~3.3 GB on the largest multigrid deck) is dominated by the transient JAX/XLA compile working set, not the equilibrium data — the spectral state, transform tensors, and solver carry together are a few MB, and a warm solve’s runtime footprint is tens of MB. It is a per-process, per-resolution compile cost that amortizes across repeated solves. Two knobs bound the optimization-time footprint:
The optimization Jacobian is column-chunked (
jac_chunk_size="auto", the same knob DESC exposes), so peak memory does not scale with the number of boundary degrees of freedom.Factoring the residual and field pipelines into reusable compiled sub-computations cut the implicit-gradient compile ~20% in memory and ~21% in wall time, bit-identically (R16).
The converged-state memo (R25.1) removed a redundant equilibrium solve per accepted optimizer iterate and cut the profiled
opt_steppeak RSS from 6.0 to 3.5 GB.
GPU guidance
Measured behavior (benchmarks/gpu_baseline.json):
Per-iteration throughput favours the GPU at every tested size (0.83 ms vs 1.90 ms per iteration at
ns=35, mpol=2, ntor=2; up to ~3x on NuhrenbergZille-class decks: 90 s vs 277 s wall).The GPU pays fixed per-solve overheads (~0.2-0.4 s dispatch/transfer floor plus compile or cache-load in cold processes), so small decks that finish in well under a second of CPU work stay faster on the CPU (
solovev: 0.043 s CPU vs 0.29 s CUDA warm).Fast desktop CPUs change the calculus: the GPU wins above were measured against the office box’s slower server cores. Against an idle Apple-Silicon CPU, the CPU wins every production workflow even at
ns = 201(the table above) — on a modern desktop, treat the GPU as an option for very large or heavily batched solves, not a default.
Device policy
vmex.core.device encodes this as a default placement rule using
the per-iteration work proxy ns * mnmax * nznt (the cost driver of the
batched-matmul transforms): below GPU_MIN_ITERATION_WORK = 100_000 the
solve stays on the CPU, above it the GPU is used. The policy is a default
only:
an explicit
device=argument tosolve/solve_multigridalways wins;if you pinned the platform yourself via
JAX_PLATFORMS(orJAX_PLATFORM_NAME), the automatic policy stands down entirely.
JAX_PLATFORMS=cpu  vmex input.solovev      # force CPU
JAX_PLATFORMS=cuda vmex input.big_case     # force GPU
Persistent compilation cache
vmex enables JAX’s persistent XLA compilation cache on accelerators,
so the multi-second compile cost is paid once per machine, not once per
process.
Warning
cwd-shadowing pitfall. Running python with a working directory
that contains a vmex source checkout can shadow the installed
package as a namespace package: vmex/__init__.py never runs, the
persistent compilation cache is never enabled, and every solve pays the
full XLA recompile (measured ~7 s vs ~1.7 s warm on CUDA for solovev).
If GPU runs are mysteriously slow, check that
python -c "import vmex; print(vmex.__file__)" points where
you expect.
Float64 is required (enforced at solver import). On GPUs this means fp64 arithmetic, but the solve is latency- rather than FLOP-bound at benchmark sizes: the tridiagonal preconditioner solve, for instance, measures identical fp32/fp64 GPU times (~15 us per radial row, independent of the number of spectral columns).
Reproducing the numbers
python benchmarks/run_baseline.py         # CPU suite -> benchmarks/baseline.json
python benchmarks/run_gpu_matrix.py       # GPU matrix -> benchmarks/gpu_baseline.json
python benchmarks/profile_production.py   # the five production workflows
pytest tests/test_parity_breadth.py     # end-to-end parity suite
The parity suite needs the golden VMEC2000 fixtures (fetched release assets); it is skipped automatically when they are unavailable.